by Andrew Farke, Director of Research & Collections, Raymond M. Alf Museum of Paleontology; Science Faculty, The Webb Schools
I teach an introductory paleontology research class for high school students (grades 10 and 11), which I have refined over three years of teaching. Of course, we read and talk about plenty of journal articles. Because we have access to the paleontology museum on our high school campus, we also have a heavy emphasis on specimen-based research projects. For instance, earlier this semester we finished a project where students wrote and illustrated a detailed description of a fossil they collected on a field trip in the fall. To follow that, I wanted to give the students a taste of another face of paleontology–that of databases. I felt it would be a great way to help them develop their analytical skills and see how hypotheses can be tested with big fossil datasets. What better way to do so than with Paleobiology Database? This site hosts thousands of records of fossils from the scientific literature, allowing an interested user to track changes in distribution and abundance for organisms through time.
Thankfully, there is a nice roster of lesson plans using PBDB already available. As I scrolled through them, though, I realized that many were probably a bit beyond what we had time or skills to discuss in class. For instance, most of the students haven’t done a lot of programming or even heavy spreadsheet use yet. After a bit of looking, I found the perfect introductory lesson–one examining the development of the Isthmus of Panama and the resulting faunal exchange between North America and South America.
Two things particularly made this lesson appealing–it dealt with easily relatable animals (large mammals), some of which the students already had encountered in labs and fieldwork. Second, it had easily testable hypotheses, requiring only the plotting of data on a map (which PBDB does automatically via its Navigator). The students didn’t have to load any special software, which was an added bonus. The goal, of course, is not to turn all of the students into paleontologists. Instead, I want them to see how the process of science works, explore tools used by scientists, and feel empowered to ask their own questions about the world around them.
To start, we practiced searching for and plotting data by taxon and time period. I had given them a brief homework assignment where they followed a video tutorial on PBDB, and generated a few quick plots (e.g., plot all birds from the Cretaceous). A minute of brief review was all that was needed to make sure the students were on track at the start of class.
As a final bit of preparation for the activity itself, I gave the students our research question—using data from fossil mammals, when were North America and South America physically linked up? Rather than giving them a “cookbook” with step-by-step directions, I had them group up into pairs and trios to talk about what kind of evidence they would need and why. I was happy to see that they were able to link the importance of age data and fossil geographic occurrence. The students decided that making a table with organism, location of fossil sites by continent, and age would be the best way to collect data.
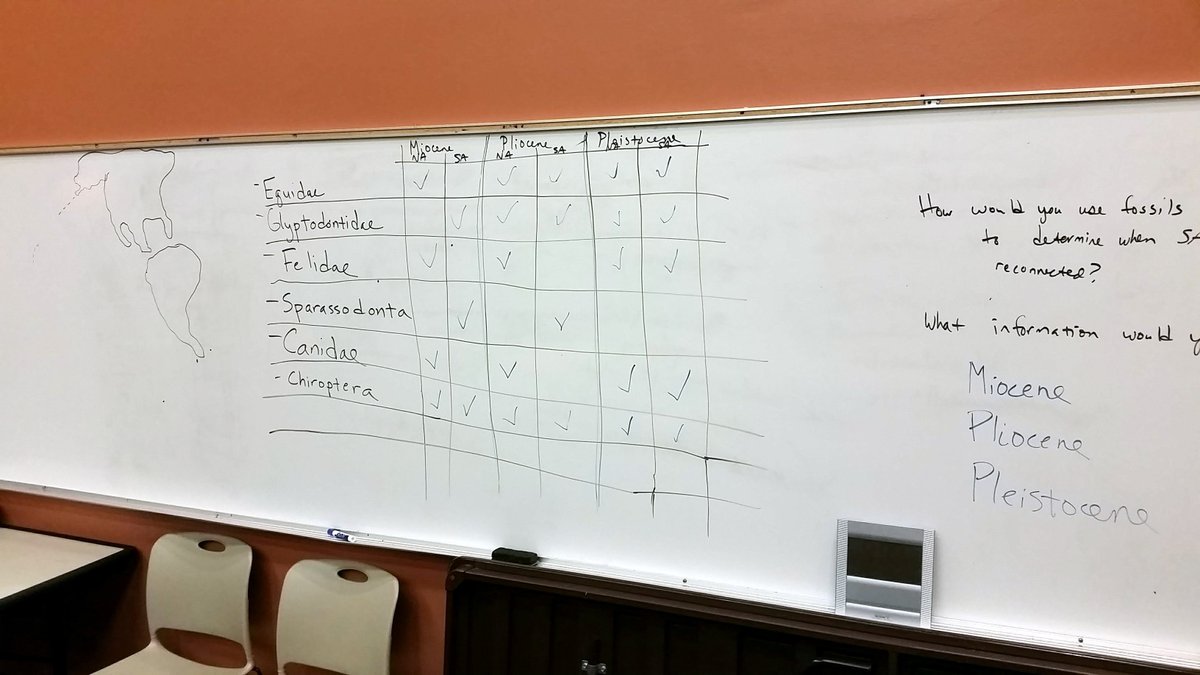
In the interest of time, I trimmed the suggested organism list from the original activity down to six taxa–Equidae, Glyptodontidae, Felidae, Sparassodonta, Canidae, and Chiroptera. We reviewed their names (many of which the students already knew, such as equids; we did have to talk about sparassodonts, though!), as well as the names of the major time periods relevant to this work.
The students then worked in their small groups on tracking the distribution of known sites for each group of mammals over time, in the Miocene, Pliocene, and Pleistocene. Rather than drawing them onto a map, I had them make a table of presence/absence for the two continents at each time interval (see photo). They had around 20 minutes to track everything down, while I circulated and answered any questions.
Finally, we reconvened to put all of our data together. We used some of the questions from the published activity, including asking the students to interpret when North and South America were reconnected (during the Pliocene was the agreed-upon scenario from the students). We also talked about why some groups might have taken longer to show up in the fossil record than others, and why bats had a pretty broad distribution throughout the studied time interval. It was neat to hear the students working through their thought processes, and asking deeper questions (such as, why were there so few sites for some time periods at certain locations?).
Informal feedback from the students shows that they found the activity enjoyable and accessible. They liked searching for and plotting data, and thought it was neat to see how animals they had collected in the field (fossil horses, for instance) changed distribution over time.
We’re using the faunal interchange activity to springboard our next major project, generating diversity curves for various marine reptile groups throughout the Mesozoic and looking at them within the context of global events. We’re still in the midst of that multi-class activity, but I can already say that these students are pretty comfortable with Paleobiology Database, the geological time scale, and hypothesis testing for these kinds of data sets!
One thought on “Faunal Interchanges, High School Students, and the Paleobiology Database”